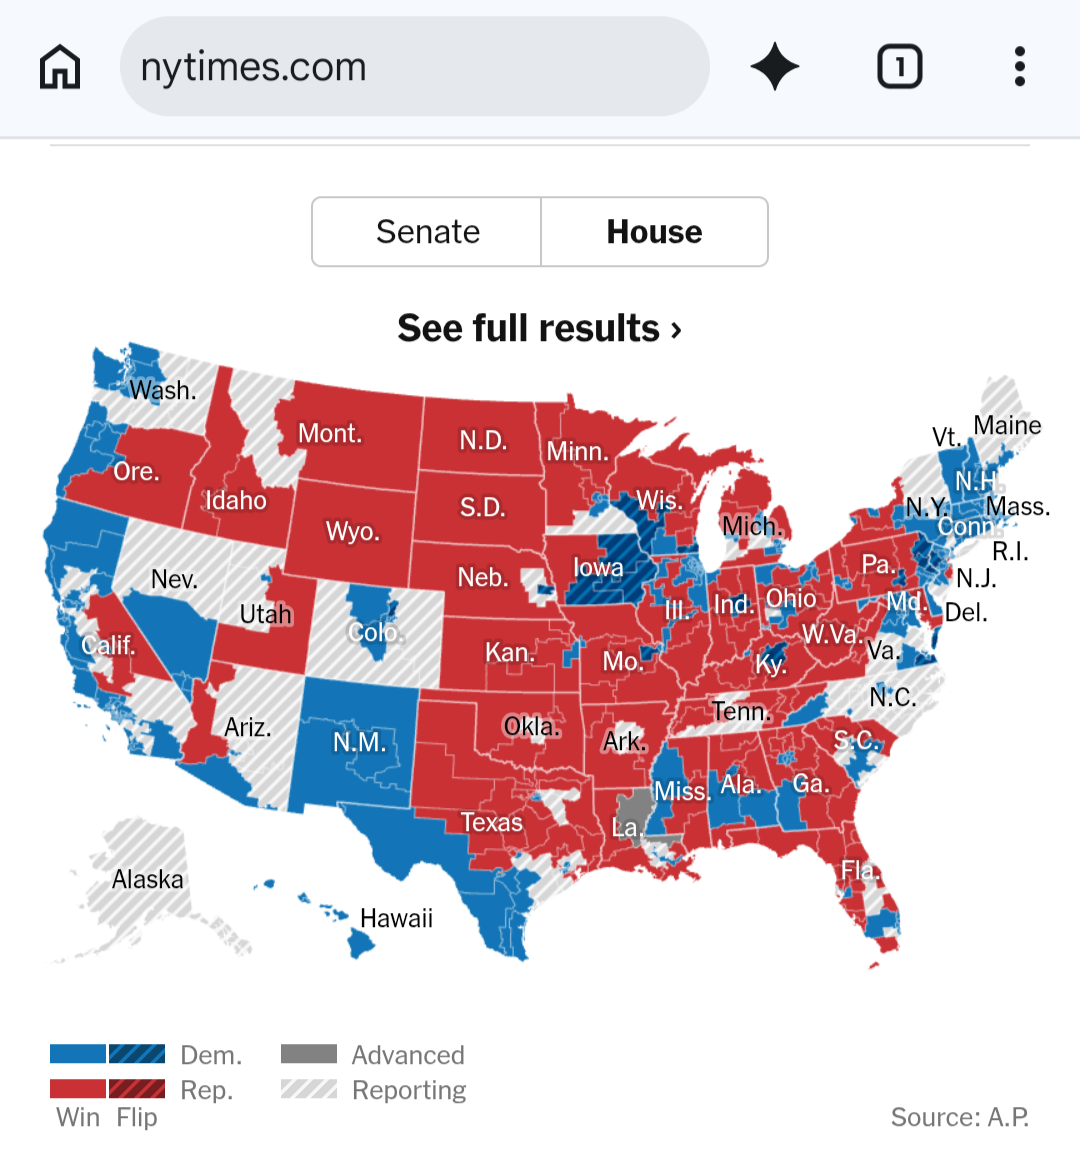
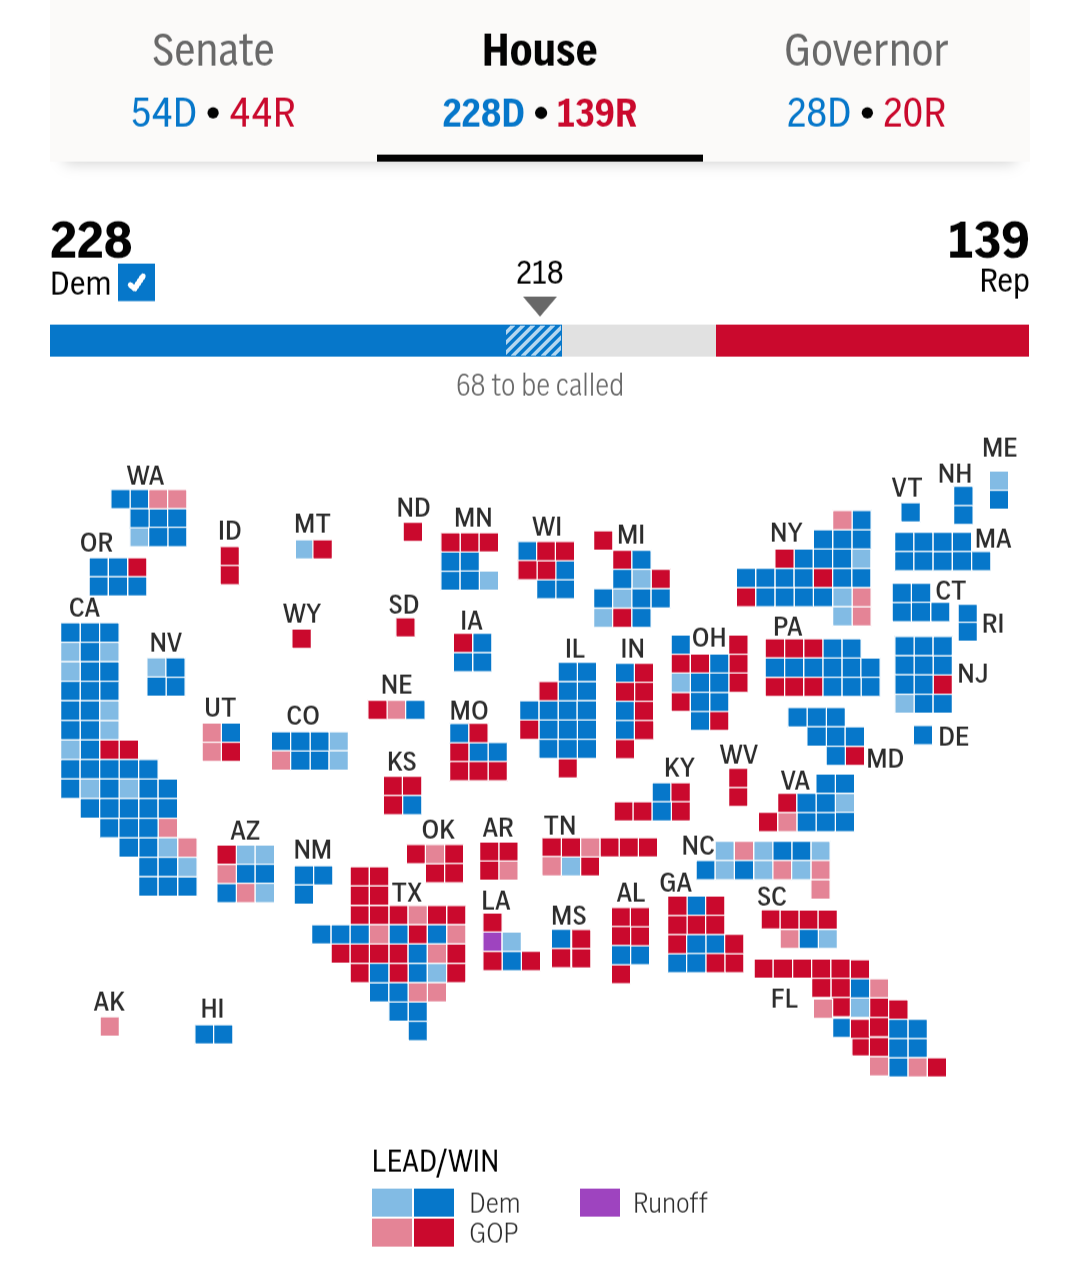
Using an area map of districts and shading it according to the winner is grossly misleading.
Huge red areas in the Midwest that have very few house seats. But you get the impression of overwhelming Republican presence in the US. The NYT gives us a terrible example.
Using a square per seat gives you a much better representation. Most of the US districts are Democrat blue. AP has a great example.
2 media files