TayFoNay, Pet Detective @tayfonay@beige.party · activity timestamp 4 hr. ago I take my workout stats seriously Read more Read less Translate Translate alt An area graph that plots the number of beers earned. A line extends diagonally up from the bottom left of the x axis at 0 up around 45 degree angle to the right. The area below the line is filled in a gold color on a black background. The Y axis plots 0, 1, 2, 3 while the X axis plots time points. I earned 3 beers. An area graph that plots the number of beers earned. A line extends diagonally up from the bottom left of the x axis at 0 up around 45 degree angle to the right. The area below the line is filled in a gold color on a black background. The Y axis plots 0, 1, 2, 3 while the X axis plots time points. I earned 3 beers. Reply Boost Quote Like More actions Copy link Flag this post Block
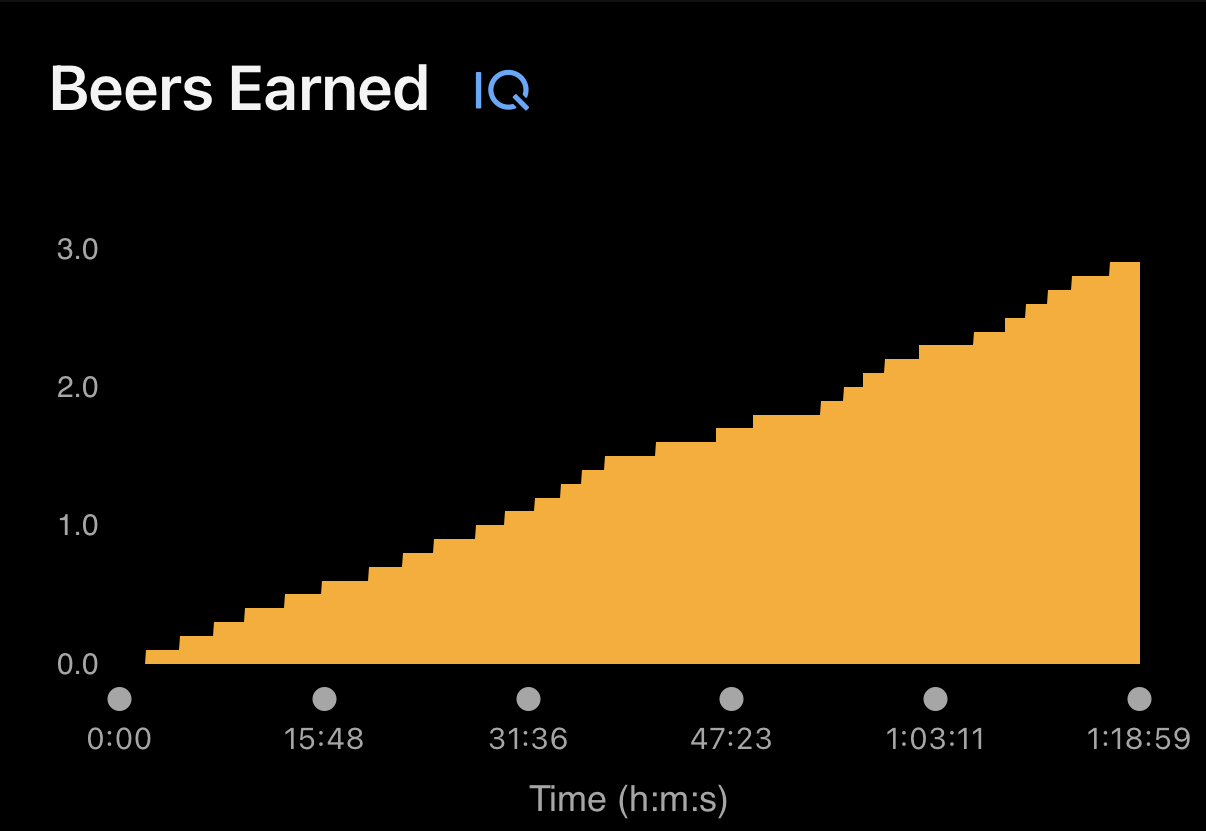
alt An area graph that plots the number of beers earned. A line extends diagonally up from the bottom left of the x axis at 0 up around 45 degree angle to the right. The area below the line is filled in a gold color on a black background. The Y axis plots 0, 1, 2, 3 while the X axis plots time points. I earned 3 beers. An area graph that plots the number of beers earned. A line extends diagonally up from the bottom left of the x axis at 0 up around 45 degree angle to the right. The area below the line is filled in a gold color on a black background. The Y axis plots 0, 1, 2, 3 while the X axis plots time points. I earned 3 beers.