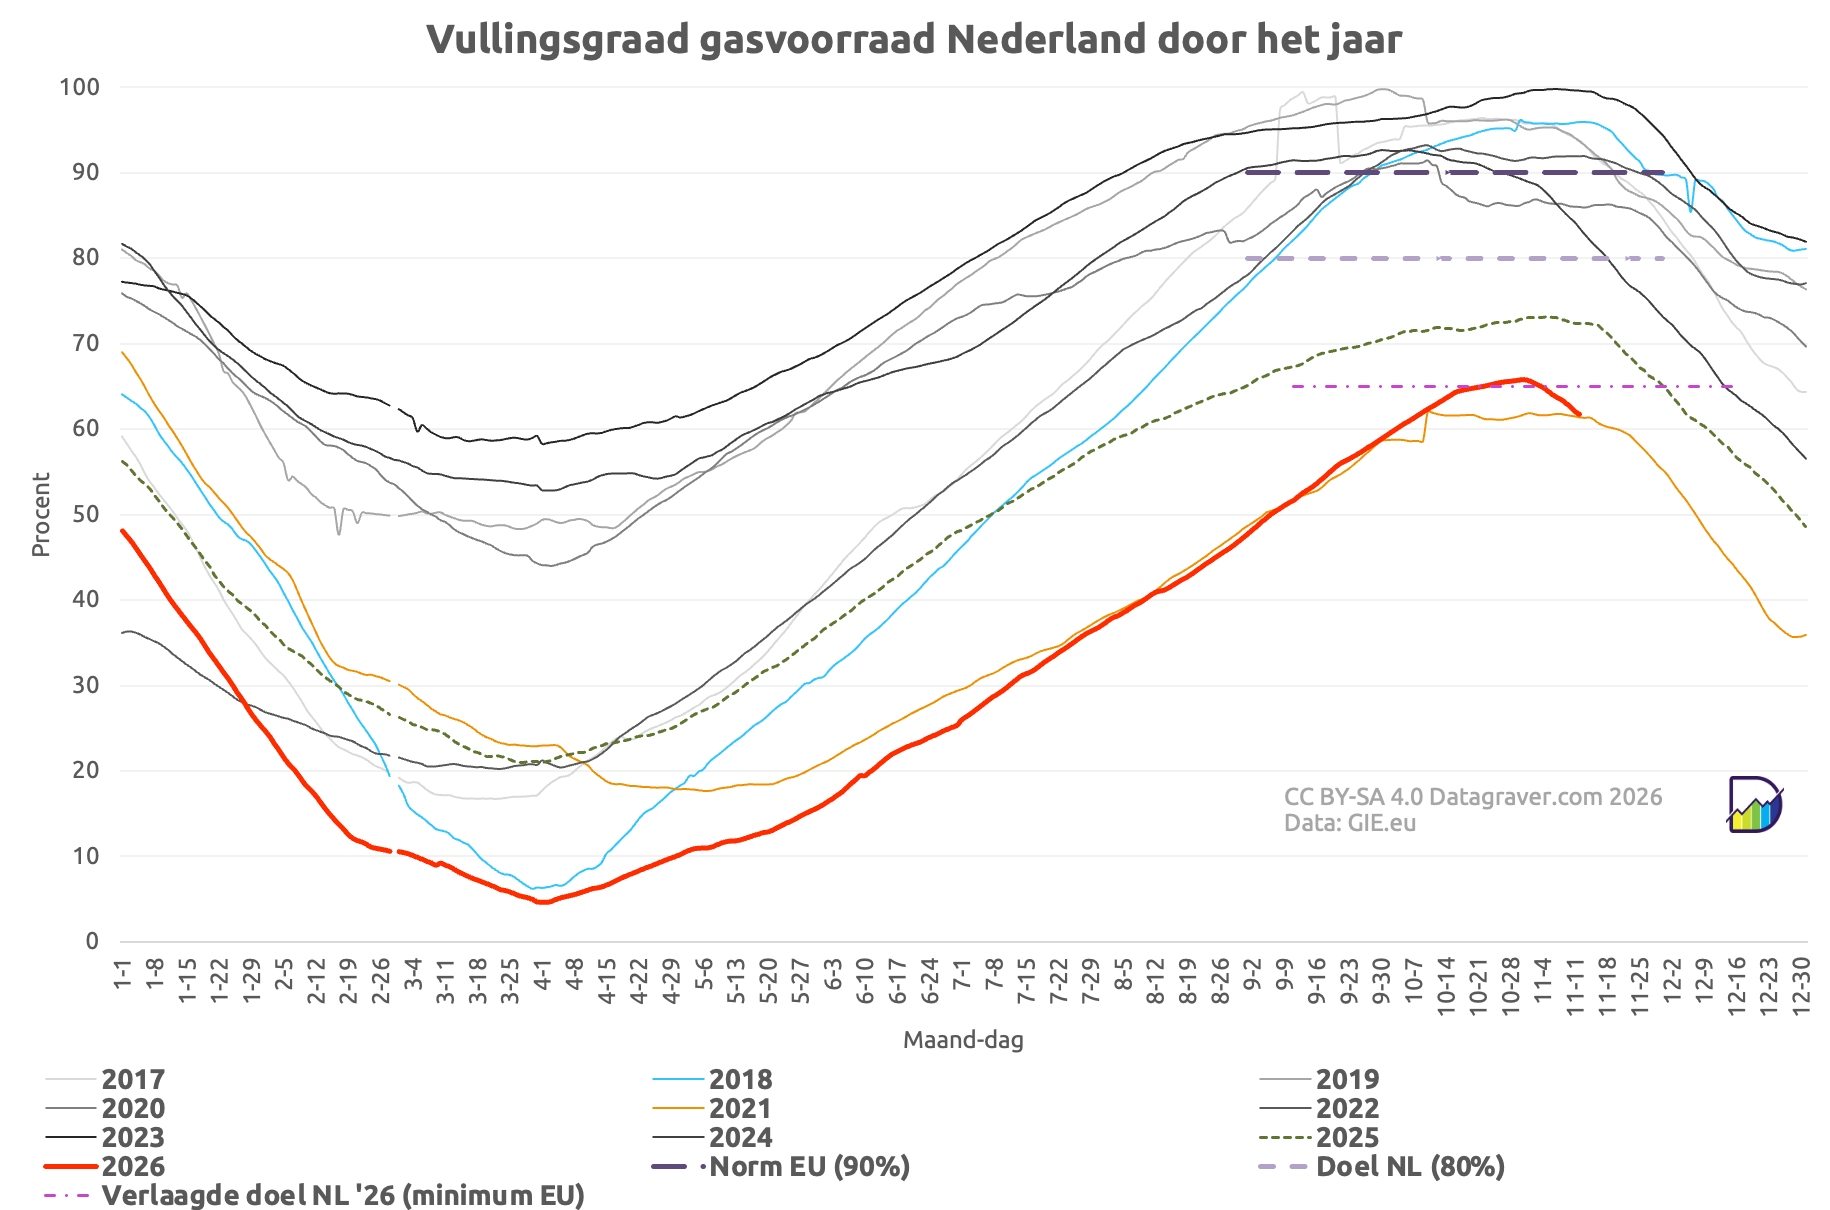
Datagraver.com @Datagraver@mastodon.social · activity timestamp 1 hr. ago Vullingsgraad gasvoorraad Nederland, per jaar. Read more Read less Translate Translate alt Grafiek met vullingsgraad gasvoorraad Nederland laatste 10 jaar. Per jaar per dag. Daarin is te zien dat 2026 niet alleen het laagste punt bereikte van al die jaren (5%) maar ook dat de groei vanaf april ver achterloopt bij de voorgaande jaren. De meeste jaren laten nu een vooraad van minimaal 90% zien, waar 2026 nog op 65% zit (wat overeenkomt met de bijgestelde minimumnorm voor dit jaar). En het daalt momenteel en is nu 62%. Bron: GIE aggregated Gas Storage Inventory Grafiek met vullingsgraad gasvoorraad Nederland laatste 10 jaar. Per jaar per dag. Daarin is te zien dat 2026 niet alleen het laagste punt bereikte van al die jaren (5%) maar ook dat de groei vanaf april ver achterloopt bij de voorgaande jaren. De meeste jaren laten nu een vooraad van minimaal 90% zien, waar 2026 nog op 65% zit (wat overeenkomt met de bijgestelde minimumnorm voor dit jaar). En het daalt momenteel en is nu 62%. Bron: GIE aggregated Gas Storage Inventory Reply Boost Quote Like More actions Copy link Share Flag this post Block
alt Grafiek met vullingsgraad gasvoorraad Nederland laatste 10 jaar. Per jaar per dag. Daarin is te zien dat 2026 niet alleen het laagste punt bereikte van al die jaren (5%) maar ook dat de groei vanaf april ver achterloopt bij de voorgaande jaren. De meeste jaren laten nu een vooraad van minimaal 90% zien, waar 2026 nog op 65% zit (wat overeenkomt met de bijgestelde minimumnorm voor dit jaar). En het daalt momenteel en is nu 62%. Bron: GIE aggregated Gas Storage Inventory Grafiek met vullingsgraad gasvoorraad Nederland laatste 10 jaar. Per jaar per dag. Daarin is te zien dat 2026 niet alleen het laagste punt bereikte van al die jaren (5%) maar ook dat de groei vanaf april ver achterloopt bij de voorgaande jaren. De meeste jaren laten nu een vooraad van minimaal 90% zien, waar 2026 nog op 65% zit (wat overeenkomt met de bijgestelde minimumnorm voor dit jaar). En het daalt momenteel en is nu 62%. Bron: GIE aggregated Gas Storage Inventory
Datagraver.com @Datagraver@mastodon.social · activity timestamp 1 hr. ago Gas storage Germany. Read more Read less Translate Translate alt Graph showing per day of the year for all years since 2017 the percentage full of the country gas storage of Germany. It shows that the current running year 2026 is well below the normal filling in this time of year at peak 61% instead of above 90% and down to 58% already. Source: GIE aggregated Gas Storage Inventory Graph showing per day of the year for all years since 2017 the percentage full of the country gas storage of Germany. It shows that the current running year 2026 is well below the normal filling in this time of year at peak 61% instead of above 90% and down to 58% already. Source: GIE aggregated Gas Storage Inventory Reply Boost Quote Like More actions Copy link Share Flag this comment Block
alt Graph showing per day of the year for all years since 2017 the percentage full of the country gas storage of Germany. It shows that the current running year 2026 is well below the normal filling in this time of year at peak 61% instead of above 90% and down to 58% already. Source: GIE aggregated Gas Storage Inventory Graph showing per day of the year for all years since 2017 the percentage full of the country gas storage of Germany. It shows that the current running year 2026 is well below the normal filling in this time of year at peak 61% instead of above 90% and down to 58% already. Source: GIE aggregated Gas Storage Inventory



Gas storage Germany.