

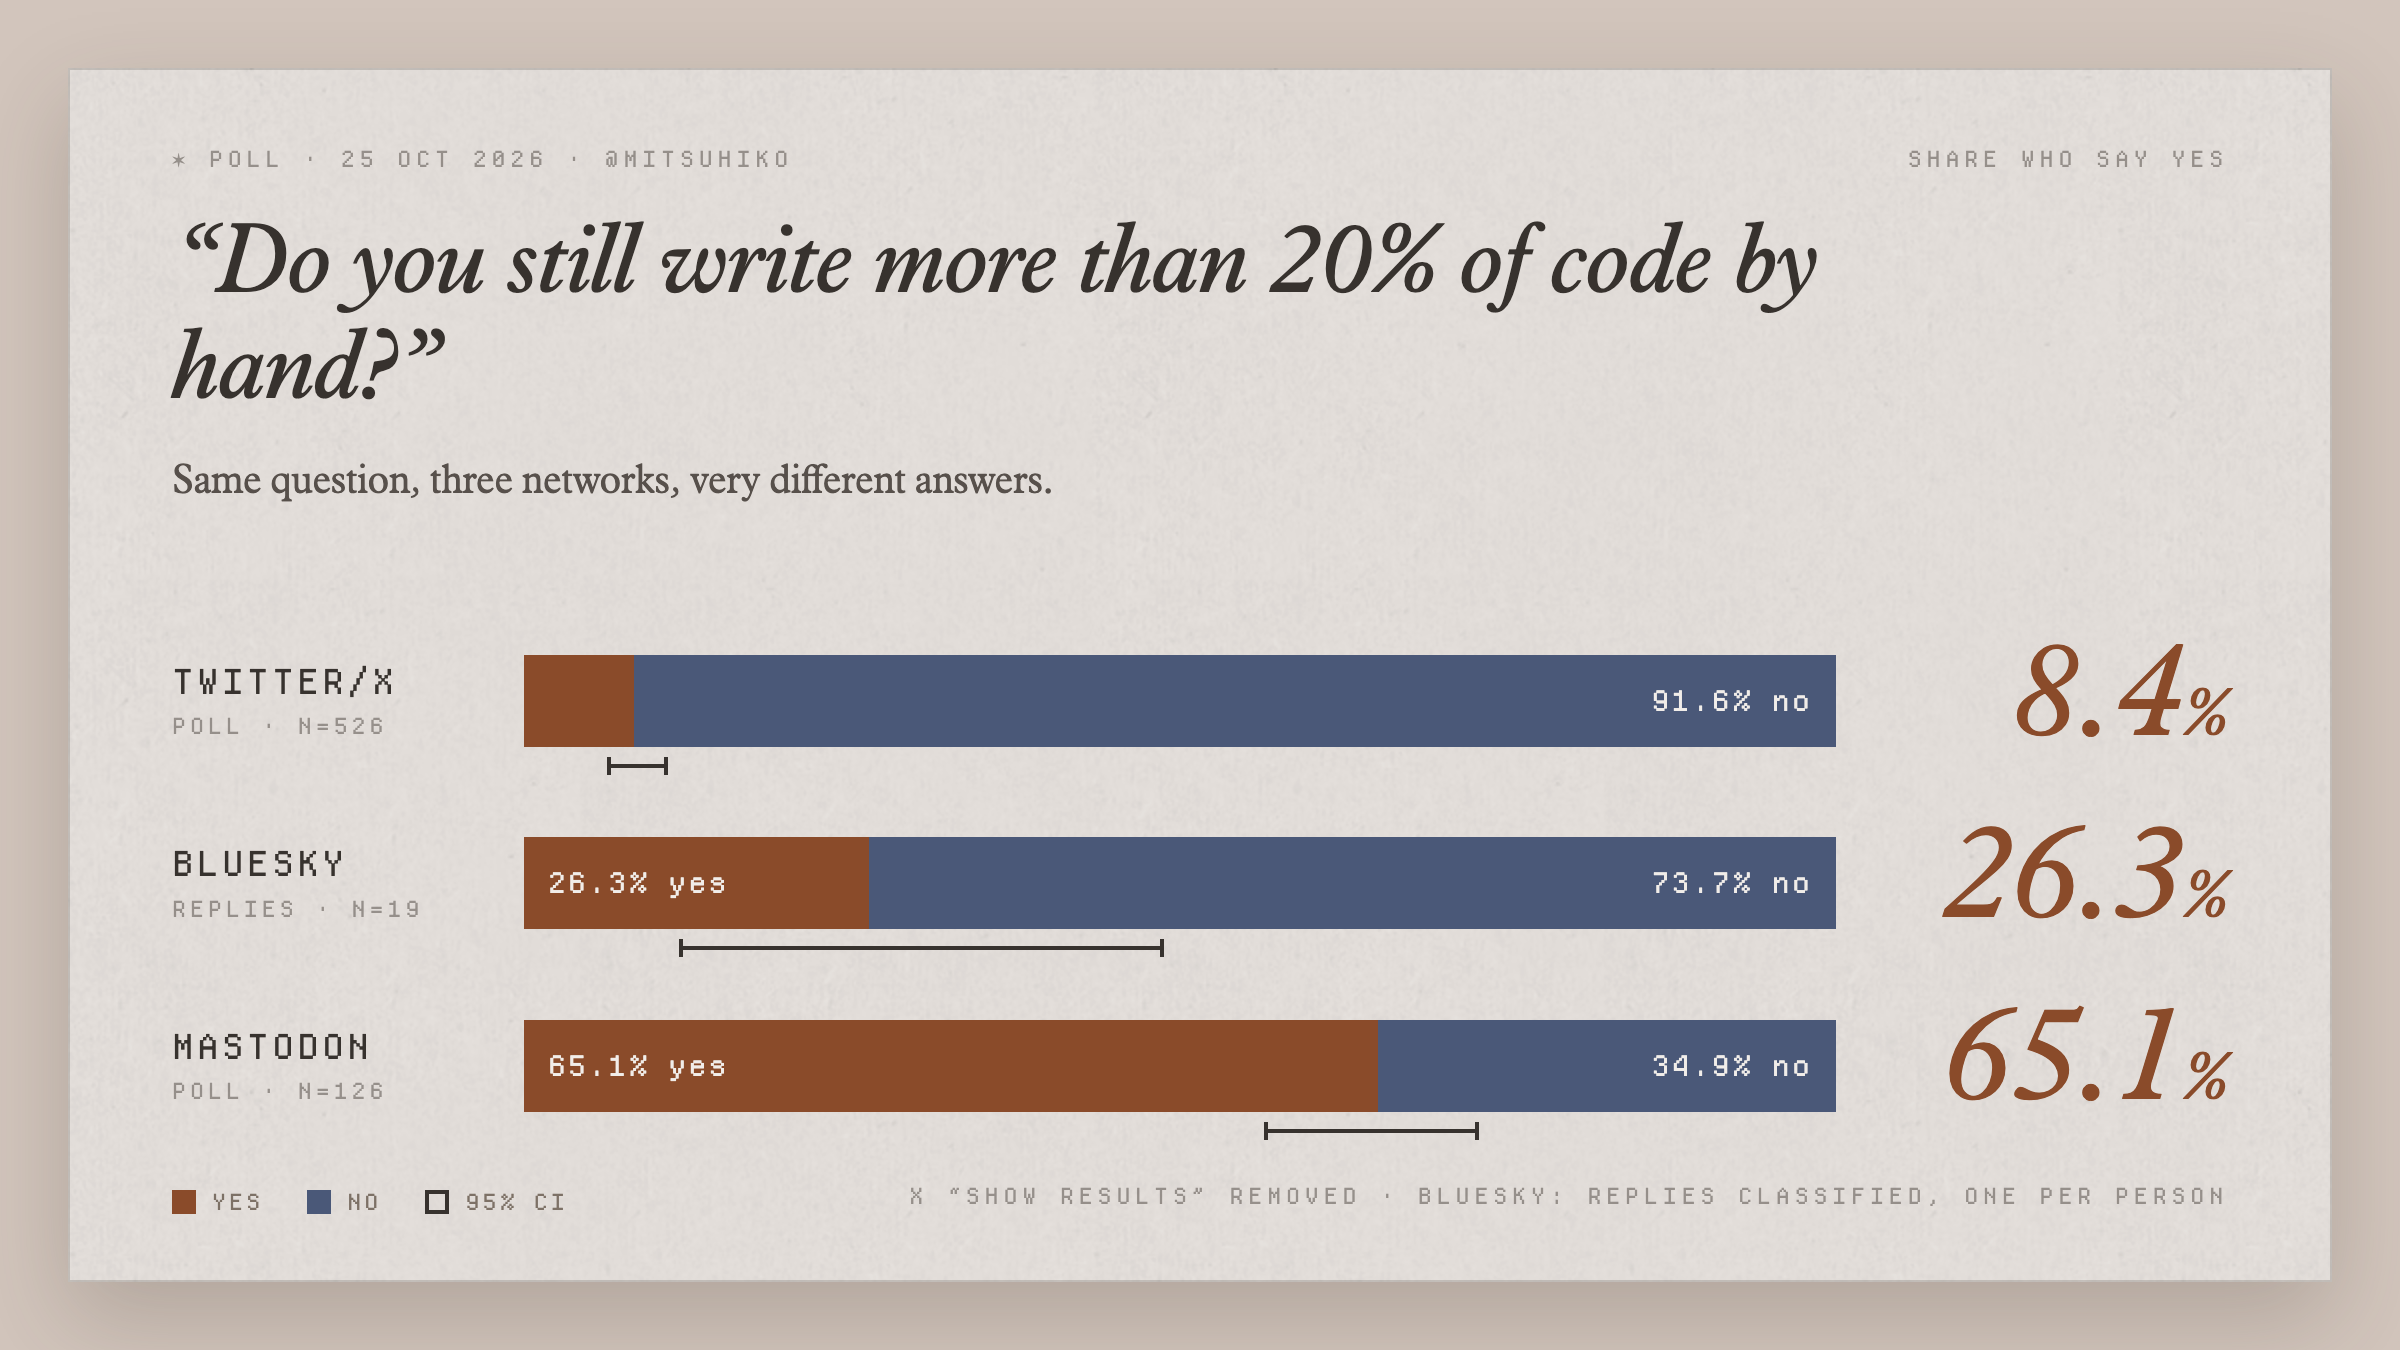
The poll so far between Twitter, Bluesky and Mastodon. I think it looks less absurd than last time, but still pretty clear that the base is divided. https://elk.zone/hachyderm.io/@mitsuhiko/117500680388532802
0 Boosts
0 Likes
And obviously this survey is pretty biased, it will be influenced mostly by which audiences engage with it. It is really just a way for me to better understand what the people who follow me on these platforms think about agentic engineering.


@mitsuhiko I am a little confused at your usage of a confidence interval here, since AIUI none of these sites support random sampling...?
@ouguoc These polls are random samples so the "confidence intervals" only show how much the share is expected to change with a small sample, not how far it might be from any real population's answer.
@mitsuhiko Hmm, okay! This is honestly kind of a mystifying answer to me, but it at least it's good to know you don't mean to use it the way it is typically used.
@ouguoc I’m not sure there is a better way
@mitsuhiko Yeah, for whatever it's worth, I believe the point you're making (that the different sites you're on have drastically different populations in this regard). Don't think the CI is useful in this regard, so I think your argument would be stronger without it.
@ouguoc Well, it was necessary because of the dramatically different N.
@mitsuhiko Well, OK, I'm a little more confused now.
I think what you are trying to estimate, in each row in your diagram, is the true proportion of each site's population that would respond yes to your question.
How a 95% confidence interval would be useful, in that world, would be to show "given the responses I got, what is the plausible range of values for the proportion?".
@mitsuhiko In that world, a low number of responses would result in a wider confidence interval. But crucially, it would require that *the responses to your poll were a random sample*, to be viable.
That's what I was asking originally. I don't think any of these sites support actual random sampling, and... I doubt you paid a pollster :)
@ouguoc Well, it's not like pollsters are getting a particularly good random sample either 😊 That's just a fundamental limitation I think? But hey, I'm not an expert in this. Really the reason I added it, is just to acknowledge the different number of people who engaged with this poll across the platforms.
@mitsuhiko Right. This is why pollsters do a *bunch* of validation on their respondents -- they ask them questions about various demographics -- and weighting, to try to synthetically approximate a random sample of the population. Scientists do the same thing in labs on their measurements every day.
That's the work you gotta do to have a basic confidence interval. It is a low-key form of lying to your reader to slap one on there without doing the work.
@ouguoc Sure, but that's not really the point of this. The question is: what other than a sample interval should be added here to express the differences in population sizes? I don't think this is particularly wrong. For as long as the audience does not change (eg: it's dragged into a completely different bubble) it's unlikely that the numbers will move much.
@mitsuhiko I think most scientists would tell you that's assuming the premises. 😊 The whole point of a confidence interval is it's specifically the end-result of having done a bunch of work to validate the randomness of the sample.
If what you want is some way to express to your reader "this is a small sample", I think your original graph's labels are sufficient for conveying that; think the rest of the viz was pretty excellent.


@mitsuhiko Amazing to see how few responses you got on Bluesky. Is that repräsentative of what you usually get in terms of interactions on the three networks? Just curious?
@michael That's because bluesky does not have a poll feature, so classified the replies instead
@mitsuhiko Ah interesting. How strange that they don’t have polls!
Thanks!


Hmmm. Can you make another picture and scale the bars with n ? Might be interesting.
@bmaxv why scale with n?
Why not? I mean... The number is already there.
I think ultimately the information from the result will be how dominant which opinion of AI is. So, it might be interesting to put the dominance *on* a platform in relation to the dominance *of* the platforms?
@bmaxv I'm trying to understand what the point of scaling to n is.


@mitsuhiko 🤔 .oO(write? I can not even able to read 20% of the code the AI writes... )
🥳

btw if people are taking issue to the small sample sizes: fair. Here is an updated graph with more respondends. Bluesky of course, given the lack of poll feature, is trickier to get right.