

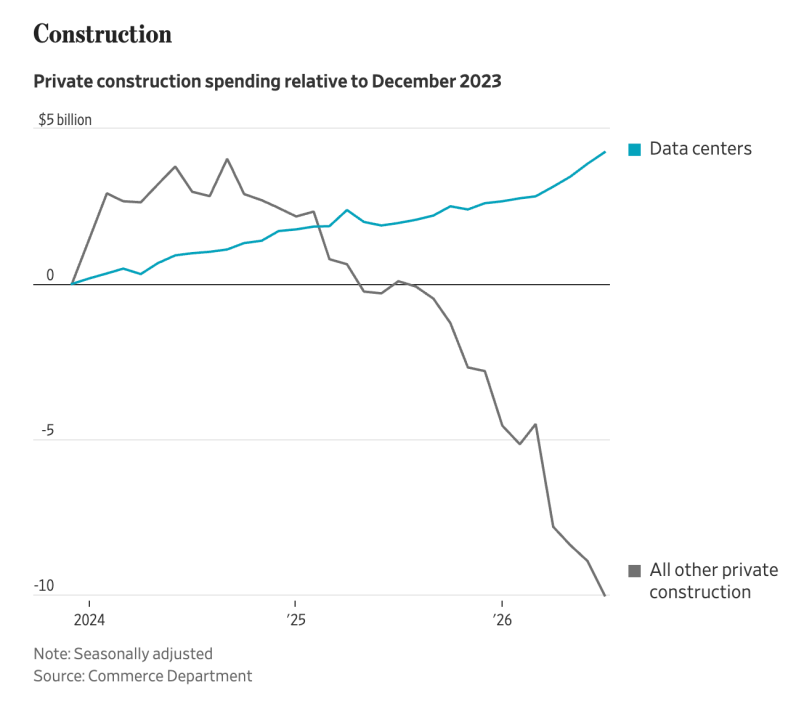
"I keep coming back to this graph because it’s so eye-popping, almost impossible to believe. As you see in the legend, the blue line is data centers. The grey line is everything else. Everything else. Commercial properties. Rental properties. Single family homes. Multiple family homes. Pick your preferred flavor of development, NIMBY, YIMBY, urban, rural, it’s in there. You basically have rapid data center growth and everything else contracting."

11 Boosts
0 Likes


@jalefkowit 4 adjoining server cabinets could be converted into like 5 sleeping platforms. What will be the rent on that after the bubble pops?


@jalefkowit this is by far the most misleading and most stupid graph I've seen relative to December 2023


Statistician here. The grey line is approaching asymptotic decline, while the blue line (lol, at its inherent cop reference) is approaching what must be done in order to keep "order" in light of, well, the grey line.


@jalefkowit oh yeah, nobody built shit this last season
costs are high and so is uncertainty


@jalefkowit feels like this graph does not tell the full picture


@jalefkowit Tech Brahs are turning the world into a 'Pfas Paradise' where the cancers roam free in abundance.. Apparently it wasn't 'fast enough' to be destroying the world by mining/fossil fuels alone..


@jalefkowit I suppose we could convert them into prisons for pedophiles and their enablers - aka pretty much all the current "administration" and the entourage.


Note the SCALE.
It's data center construction is up a whole FIVE percent.
And other construction is down TEN percent.
Ugly. But not insane.

@jalefkowit K shaped graph for K shaped economy!


@jalefkowit during the Biden admin, there were a bunch of frustrated think pieces about the so-called "vibecession" - "the economy numbers are good, why do all the polls say people think it's bad, are they stupid?"
I'm glad we've finally managed to concentrate that disconnect into a single activity by a single sector

@jalefkowit @aeva shiiiiiiiiiiii

@jalefkowit I'm trying to understand this chart. How exactly does one spend negative amounts of money on building things that aren't data centers?

@jalefkowit it looks like this chart is US-specific
it'd be very interesting to see this for other countries - I *think* Australia won't be anywhere near as bad as this, but a few of the medium sized data centre companies have been operating from here (Sharon, Firmus) so I do wonder...


@jalefkowit I'm presuming this in in the USA. If so, you might want to make that clear - not sure the picture is the same globally.

@jalefkowit From the article conclusion : "The simple reality we see here is that a tiny number of people — dozens at most, mostly in Silicon Valley — are able to drive the direction of the whole economy and in a way that at least in the short-term (the long term probably too, but I’m just talking about what we factually observe right now) is straining everyone else."
In other words, the US economy has been hijacked by a small clique with the power of words alone.